Transparent PBM reporting and analytics for better budget control.


Transparent PBM reporting and analytics for better budget control.
A standard quarterly pharmacy benefit manager (PBM) summary arrives after the quarter has already closed, once the spend is locked in, and there's no way to trace which drug, which pharmacy, or which plan design decision drove the number. Transparent PBM reporting and analytics close that gap by going deeper than a static summary, giving a plan sponsor something to act on before the next year or renewal.
This piece breaks down where legacy reporting falls short, what a transparent report should actually include, and the workflow a benefits or finance leader can run against their own claims data to turn that visibility into lower drug spend.
Key highlights
- PBM reporting and analytics are the record of what was dispensed, paid, and passed back, and the layer that interprets that record to find cost drivers and forecast spend.
- Transparent reporting and analytics give employers claim-level visibility they can act on mid-year, not just a rearview summary after the budget is already spent.
- Rightway pairs monthly drug-level reporting, quarterly audit-ready reviews, and a self-service portal with real-time dashboards so plan sponsors can see and model their own pharmacy spend.
What is PBM reporting and analytics?
Pharmacy benefit manager (PBM) reporting and analytics is the combination of claim-level records and the tools used to interpret them.
- Reporting is the record: What was dispensed, what the plan paid, what the pharmacy received, and what rebate came back, tied to a specific claim and drug.
- Analytics is the interpretation layer built on top of that record: Spotting which drugs or categories are driving cost, flagging utilization patterns before they become a budget problem, and forecasting what a plan design change will do to spend.
A plan sponsor needs accurate claim records and the analysis built on them. Forecasts built on incomplete records aren’t reliable, and records nobody interprets don’t reveal what’s driving cost. Plan sponsors increasingly weigh this when they evaluate vendors: the capability climbed from the ninth to the sixth most important factor in choosing a PBM year over year, according to PSG's Pharmacy Benefit Manager Customer Satisfaction Report.
Where legacy PBM reporting leaves money on the table.
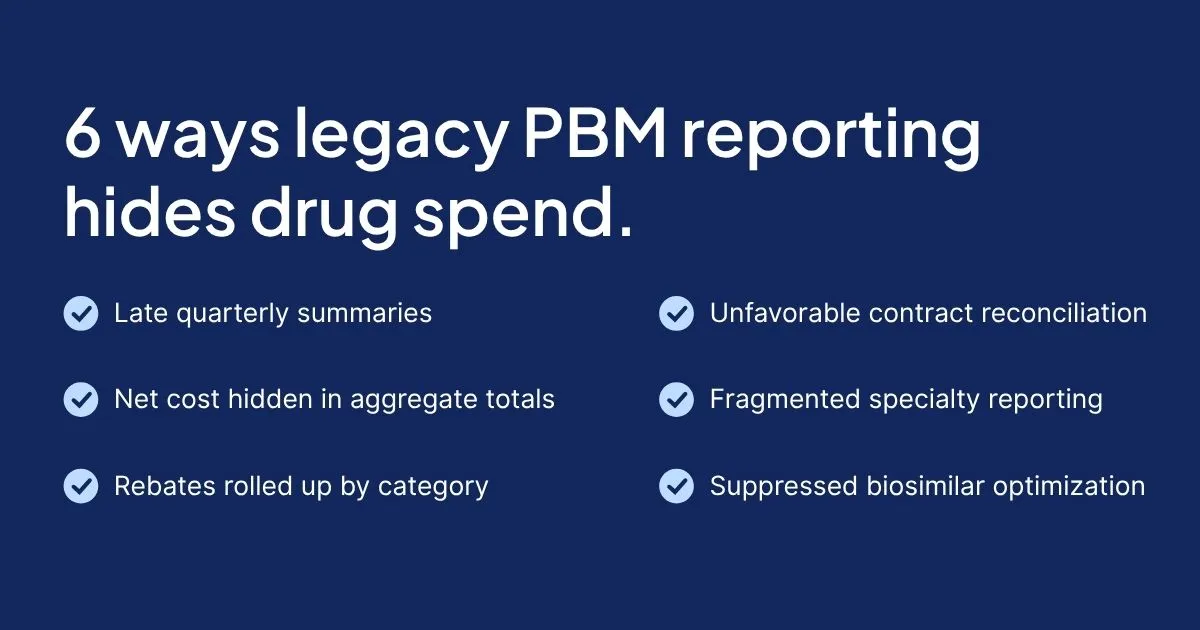
Legacy PBM reporting hides more than it reveals, and that gap costs plan sponsors real budget:
- Static quarterly summaries land too late to change spend: A report that arrives 90 days after the quarter closes tells a plan sponsor what already happened, not what to do differently.
- Aggregated totals hide net cost at the claim and drug level: When legacy PBM reporting rolls PBM claims data up into a single spend number, there's no way to see which specific drug or pharmacy is driving that total. A plan can look stable on the surface while spread pricing on high-cost drugs quietly eats the budget.
- Rebate reporting rolls up by category, masking pass-through gaps: Category-level rebate totals make it nearly impossible to confirm that every eligible claim actually generated and passed through its rebate.
- No reconciliation of paid claims against contract pricing guarantees: Without claim-level reporting, a plan sponsor has no way to know whether the PBM actually delivered the pricing it promised under its drug pricing model.
- Specialty spend is buried across the pharmacy and medical benefits: Specialty drugs often run through both the pharmacy and medical benefit, and when reporting doesn't combine the two, a plan sponsor sees only part of its real specialty exposure.
- Brand-versus-generic and biosimilar savings go unflagged: When a report doesn't flag which brand claims have a lower-cost generic or biosimilar equivalent available, that savings opportunity sits unused.
Why transparent PBM analytics matter for budget control.
Transparent PBM analytics matter because they turn the static-reporting problem into something a plan sponsor can act on before the budget cycle closes, not after. U.S. pharmaceutical expenditures grew 10.2% in 2024 to $805.9 billion, according to the American Journal of Health-System Pharmacy. A retrospective report that lands weeks after a claim doesn't give a plan sponsor time to respond to that kind of cost increase.
Monthly reporting, including claims experience, plan spend by employee group, top drugs, and top therapeutic classes, shows what's changing well before quarter-end. A quarterly business review gives the plan sponsor a fully auditable accountability check, with no surprises and no fine print. And a self-service portal layer adds real-time claims insight and dashboards on top of both, so a benefits leader can see a developing cost issue as it happens instead of waiting for the next quarterly review.
Predictive modeling closes the loop. Instead of waiting to see what a formulary, copay, or tiering change actually does to spend, a plan sponsor can model the impact, disruption, and savings before making the change.
What should be included in a modern PBM report?
A modern PBM report should include total plan spend and cost per member per month (PMPM), net cost by drug, rebate detail by drug and pharmacy, specialty-drug spend across both benefits, and savings by program with a clear return on investment.
| PBM report component | What it shows | Why it matters for budget control |
|---|---|---|
| Total plan spend and PMPM | Overall drug spending and per-member costs are tracked over time to show spending trends. | Comparing total spend with PMPM trends helps identify cost increases independent of changes in plan membership |
| Net cost by drug | Drugs and therapeutic classes are ranked by their actual costs after rebates. | This breakdown reveals the true drivers of pharmacy spending that list prices may obscure |
| Rebate details by drug and pharmacy | Rebate dollars are tied to the specific drugs, pharmacies, and claims that generated them. | Claim-level visibility helps verify full rebate pass-through rather than relying on category-level estimates |
| Specialty-drug spend | Specialty-drug spending is combined across both pharmacy and medical benefits. | A complete view of specialty-drug costs helps plan sponsors manage a category that accounts for more than half of net drug spending |
| Savings by program and PBM ROI | Savings from formulary management, adherence initiatives, and other programs are measured individually. | Understanding each program's financial impact helps determine which initiatives deliver measurable value and justify continued investment |
How to use PBM reporting and analytics to lower drug spend.
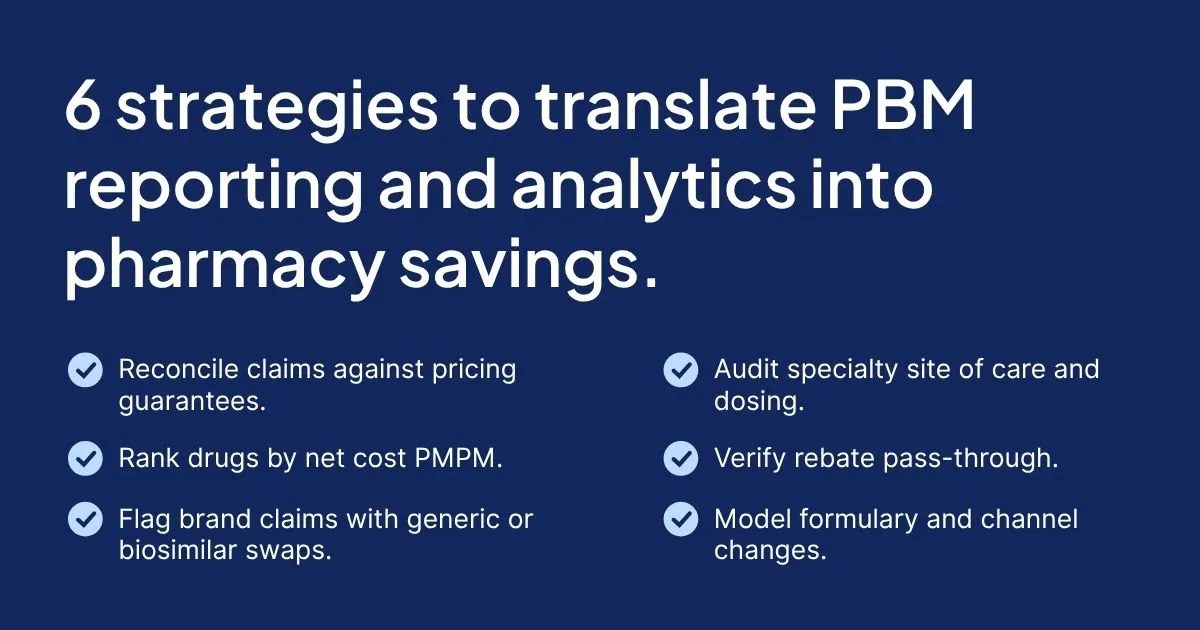
A transparent PBM's reporting and analytics should catch cost trends early and drive them down. Here's what your PBM should be doing if you want to see costs come down.
1. Reconcile every claim against your contract's pricing guarantees.
Your reporting should break out claim-level drug costs, ingredient cost, and dispensing fee for every fill, then match the paid amount against your contract's discount and dispensing-fee terms. Any gap is money to recover, so flag it before your next renewal.
2. Rank drugs by net cost per member per month, not list price.
A drug's list price doesn't always reflect what your plan actually pays. Rebates, discounts, and other price concessions can significantly change the final cost, making list price an unreliable measure of pharmacy spending. Instead, ask your PBM to rank drugs by net cost after PBM rebates and cost per member per month (PMPM). This gives you a clearer picture of which medications are driving spending across your plan.
3. Flag every brand claim with a lower-cost generic or biosimilar equivalent.
Strong analytics check every dispensed brand drug against available generics and biosimilars and total what's still being paid at the higher price. Use that number to push a drug formulary or step-therapy change where it makes sense.
4. Audit specialty claims for site of care and dosing.
Specialty drug management claims should show which benefit they're billed under, whether the site of care is the lowest-cost setting, and whether dosing matches the label. Specialty cost per member per year rose from $1,333 in 2023 to $1,641 in 2024, according to PSG, so a single correction on a claim like this carries real weight.
5. Verify rebate pass-through against what was invoiced.
Rebate dollars received should tie back to the specific claims that generated them, not just a category total. The Consolidated Appropriations Act of 2026 now requires PBMs to pass through 100% of rebates quarterly, within 90 days of quarter-end, and gives plan sponsors the right to audit that pass-through with their own chosen auditor. This underscores the importance of choosing a pass-through PBM model.
6. Model formulary and channel changes before they take effect.
Before a formulary tier move, a copay or adherence incentive change, or a mail-order shift goes live, ask for the projected impact, disruption, and savings. Reviewing that forecast before approving the change means the next cycle starts from your own numbers instead of a guess.
See your drug spend clearly with Rightway's PBM analytics.
Rightway runs as an aligned, fully transparent PBM: 100% rebate pass-through, no spread pricing, no owned pharmacies, 0% supply chain ownership, and a neutral formulary, backed by full audit rights and unrestricted access to your own claims data.
With Rightway's PBM solution, clients get monthly reporting at the drug, pharmacy, and therapeutic-class level, a fully auditable quarterly report built for complete accountability, and a self-service client portal layered on top with real-time claims insight, ROI dashboards, and predictive modeling for formulary, copay, and tiering changes before they go live.
Rightway pairs an aligned, pass-through model with claim-level analytics you can act on, so you can see exactly where your drug dollars go and take control of them.
Curious what that could look like for your plan? Book a demo.
Pharmacy claims, made clear and actionable with Rightway.
Book a demoFrequently asked questions.
The difference between a standard PBM report and PBM analytics comes down to what each one does with the data. A standard report is the record: what was dispensed, what was paid, and what rebate came back on a given claim. Analytics takes that record and interprets it, surfacing which drugs or categories are driving cost and forecasting what a plan design change would do to spend.